SimPlot-CL: Automated Similarity Plotting from the Command Line
SimPlot-CL: Automated Similarity Plotting from the Command Line
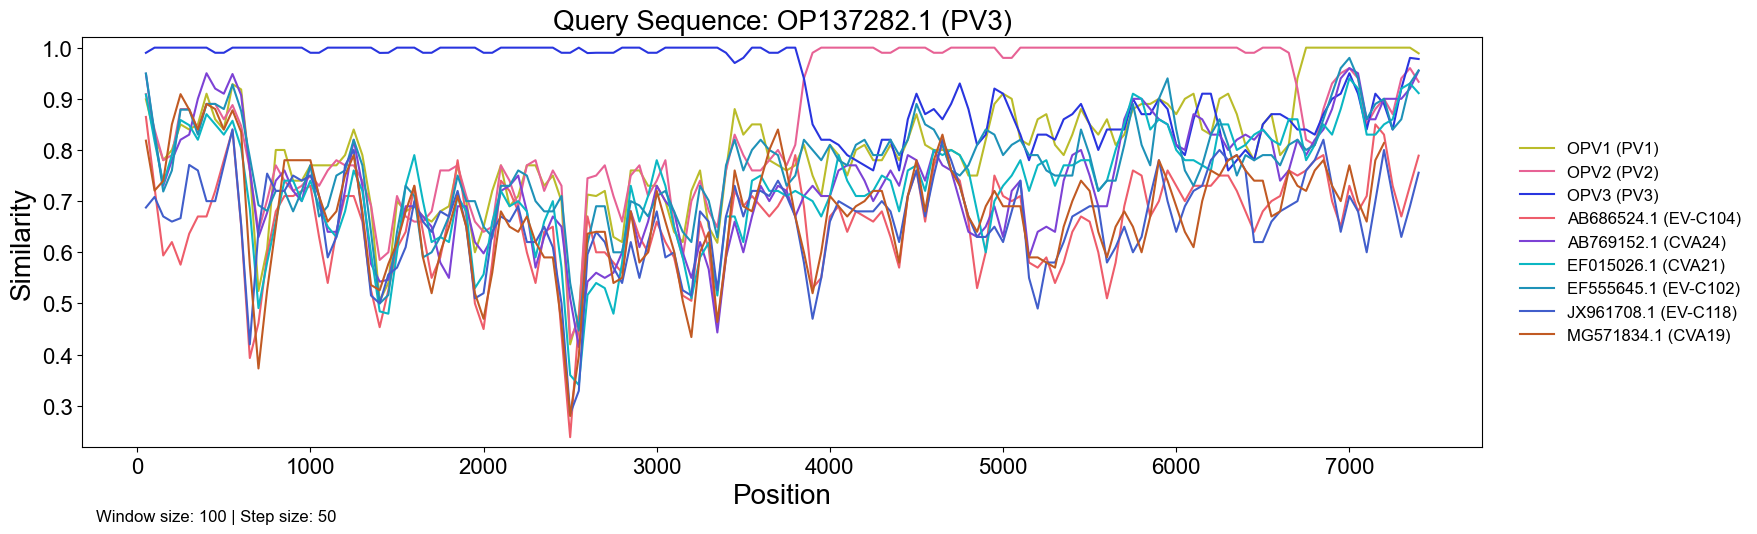
We are excited to share SimPlot-CL, a lightweight, Python-based command-line tool that enables automated similarity plot (SimPlot) analyses for multiple query sequences against a set of references.
Similarity plots are widely used in viral genomics to visualize how closely a query genome resembles a set of reference sequences along its length - for example, to explore recombination signals, genotype relationships, or mosaic genome patterns. While graphical tools such as the original SimPlot (Lole et al., 1999) and SimPlot++ (Samson et al., 2022) provide user-friendly interfaces, they can become cumbersome when running large batches of analyses.
SimPlot-CL was developed to solve exactly that problem: enabling automated similarity plotting analyses directly from the command line. The easy-to-use, open-source code behind SimPlot-CL is available on our GitHub.
What SimPlot-CL Does
Given sets of query and reference nucleotide sequences in FASTA format, SimPlot-CL:
- Optionally aligns sequences using MAFFT
- Splits the alignment into overlapping sliding windows
- Computes pairwise similarity (1 − p-distance) between a query and reference sequences in each window
- Groups and colours sequences by genotype (if specified in metadata)
- Produces:
- Publication-ready similarity plots (PNG, PDF, SVG, or JPG)
- Optional CSV tables with window-by-window similarity values
Why It’s Useful
SimPlot-CL is particularly helpful for researchers who:
- Work with large viral genome datasets
- Need to compare multiple queries against a panel of references
- Want reproducible, scriptable analyses for pipelines or HPC environments
- Prefer automation over manual GUI-based workflows
Because it runs entirely from the command line, it integrates easily into bioinformatics pipelines and allows high-throughput analyses without repetitive manual steps.
Flexible and Customizable
The tool supports:
- Custom window and step sizes
- Different gap-handling strategies
- Separate query and reference alignments, or specifying query and reference sequences from one alignment
- Optional genotype annotations by integrating metadata
- Custom color mappings
- Optional export of similarity tables and alignments
This makes it suitable both for quick exploratory analyses and for generating figures for publications.
Code and Documentation
The full source code, example datasets, and usage instructions are available on our GitHub.
The repository includes example commands, demo datasets, and customizable metadata/color configurations to help you get started quickly. Contributions, feedback, and feature suggestions are very welcome!
References
Original SimPlot software: https://sray.med.som.jhmi.edu/SCRoftware/SimPlot/
Lole, Kavita S., et al. “Full-length human immunodeficiency virus type 1 genomes from subtype C-infected seroconverters in India, with evidence of intersubtype recombination.” Journal of virology 73.1 (1999): 152-160.
SimPlot++ (modern GUI version): https://github.com/Stephane-S/Simplot_PlusPlus
Samson, Stéphane, Étienne Lord, and Vladimir Makarenkov. “SimPlot++: a Python application for representing sequence similarity and detecting recombination.” Bioinformatics 38.11 (2022): 3118-3120.
MAFFT: https://mafft.cbrc.jp/alignment/software/
Katoh, Kazutaka, and Daron M. Standley. “MAFFT multiple sequence alignment software version 7: improvements in performance and usability.” Molecular biology and evolution 30.4 (2013): 772-780.

Keno Strotjohann
PhD student