What Do People Really Think About Our Coffee?
What Do People Really Think About Our Coffee?
A Rigorous (But Fun) Survey of Coffee Preferences at Swiss TPH
A bit over 10 months ago, during a completely normal lunch, we somehow ended up discussing coffee at the institute. For the newcomers at the table, we explained the situation: real milk can only be used downstairs in the cafeteria, while upstairs it’s powdered milk all the way. At some point, someone boldly announced they were going to cut down their coffee intake - at the time, a modest 6 cups per day.
That got us thinking: what do people actually think about the coffee here? Too bitter? Too watery? Too artificial (especially the milk)? Not long after, one PhD student present at that lunch (me) decided this clearly required a proper, institute-wide survey.
How We Did It
The survey questions were generated with ChatGPT - it only took 34 prompts - combined with human creativity and ruthless editing. We used Google Forms and advertised it the old-fashioned way: QR codes printed and placed next to every coffee machine in the upper floors. (Not intended for malware and phishing training, I swear!) As Google Forms lets you see results in real-time, we had a way to follow as the answers unfold.
Interestingly, we quickly realized that tea drinkers felt left out - they opened the survey and found mostly coffee-related questions. So we added a dedicated tea section (thanks to Nosi for major editorial contributions) and introduced branching logic, sending tea and coffee drinkers down different paths based on their initial answer.
A Note on Bias
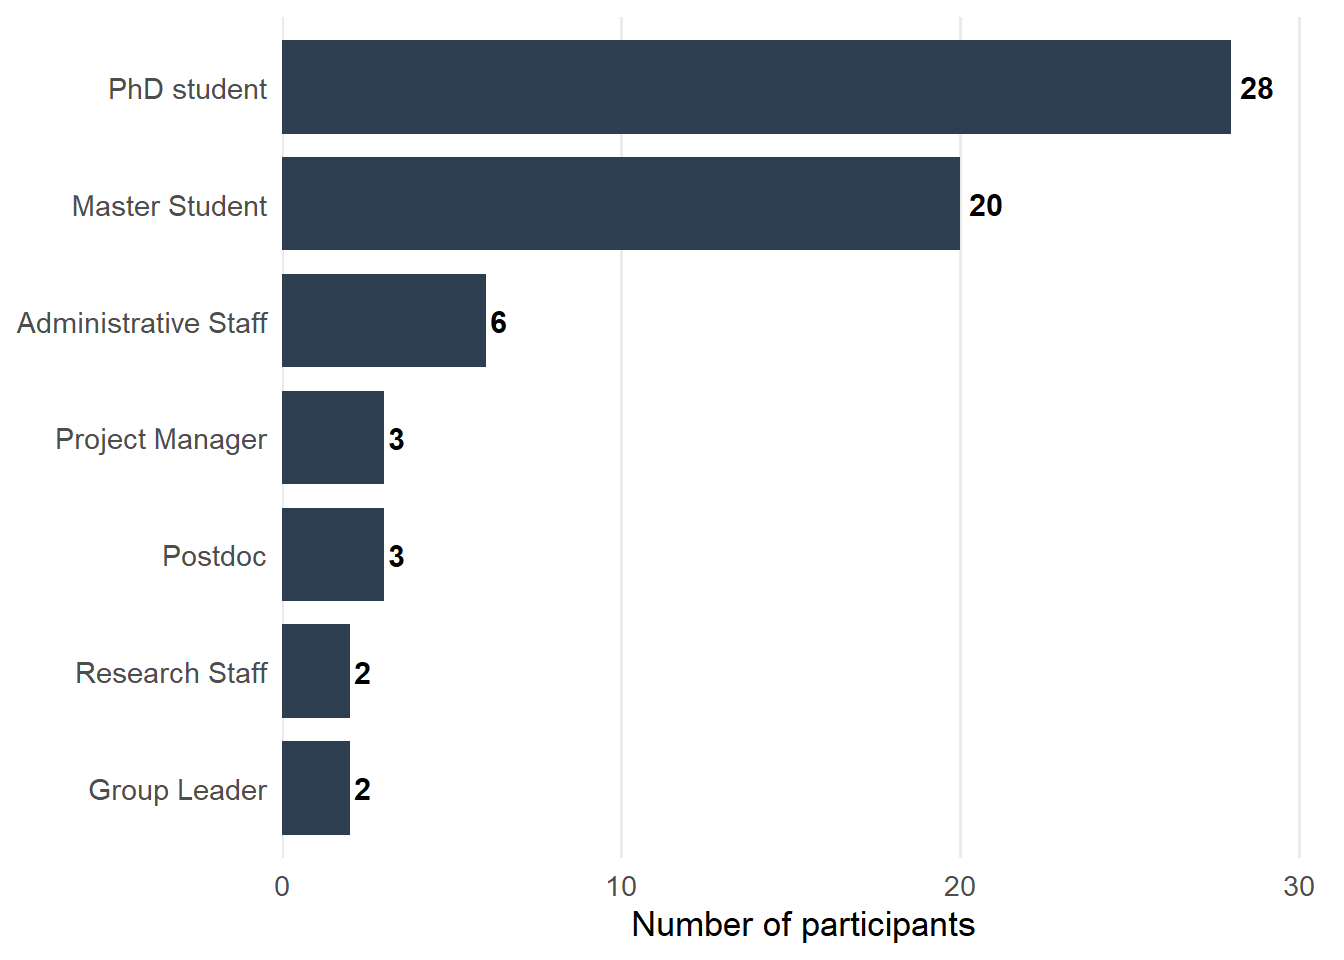
The Swiss TPH has 950 staff and students employed, around 250 of whom are students (Master or PhD). We received 64 responses (after removing duplicates), with the majority being PhD or Master’s students (see Fig 1). This huge over-representation of students likely reflects how we shared the survey: the QR codes weren’t super effective, so we circulated the link through several student channels in August 2025. As a result, we large missed senior staff, lab technicians, and the directorate - either because they wisely avoided random QR codes or because they were busy doing actual work. So keep in mind: we have a student-centric view of Swiss TPH’s coffee culture.
Tea or Coffee? How many cups?
(And Does Hierarchy Matter?)
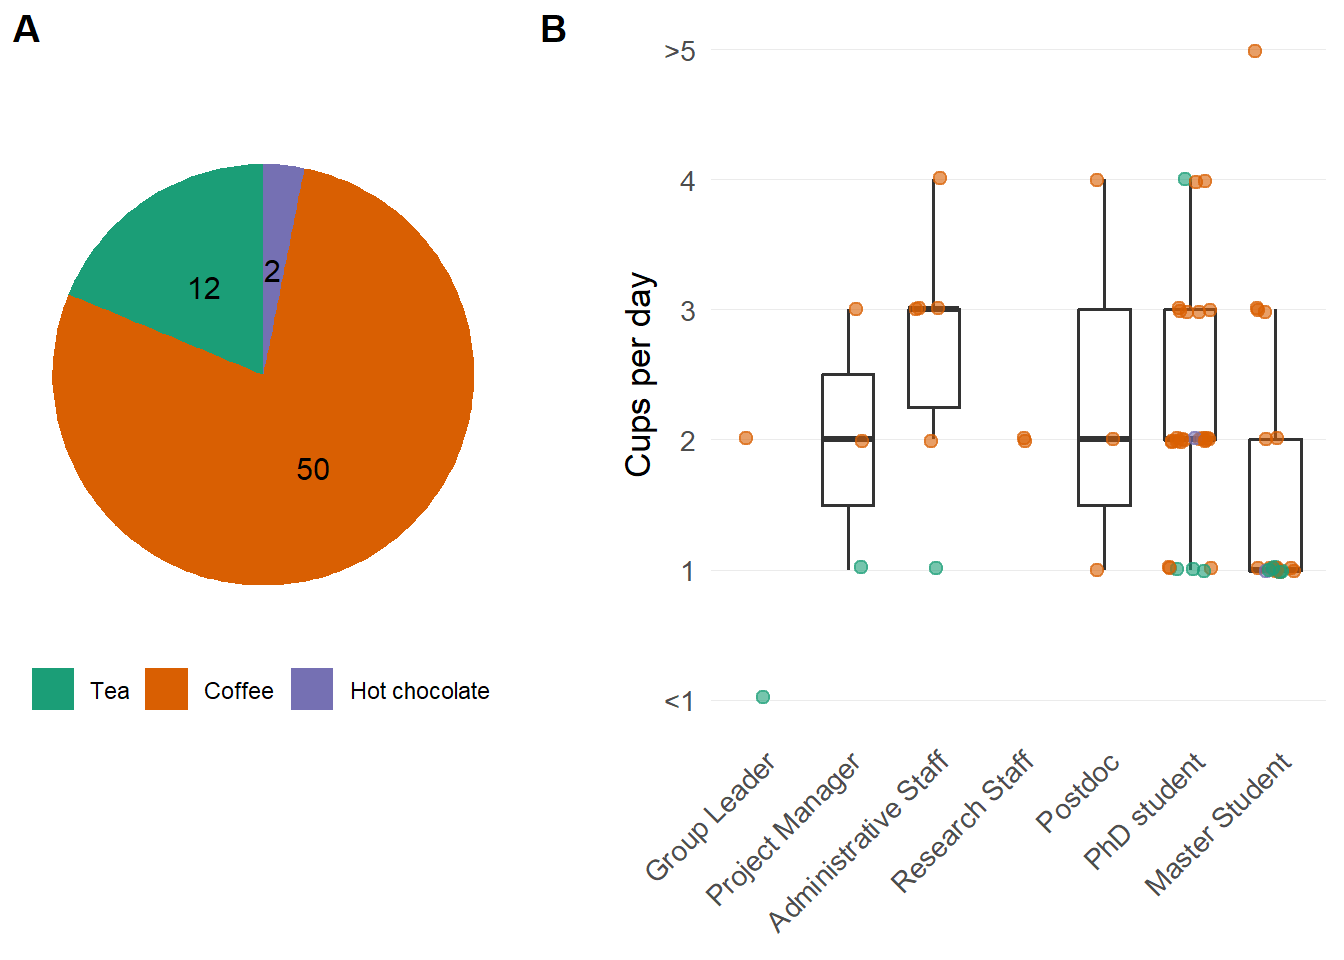
And the winner is… coffee. Sadly for the tea drinkers, the results are quite clear: the vast majority prefer coffee (Fig 2A). There was, however, one interesting outlier - someone who prefers herbal tea but still usually drinks coffee. Possibly the same person trying to cut down from 6 cups a day?
As for how many cups per day people drink, the relationship between academic hierarchy and coffee consumption is less dramatic than we might have expected (Fig 2B). Group leaders and research staff have only 2 people each (statistically meaningless), but the median hovers around 2 cups per day across all roles. Students tend to drink slightly less, administrative staff slightly more. No clear evidence that higher academic positions require more caffeine - if anything, it seems fairly evenly distributed.
When Do People Drink Coffee?
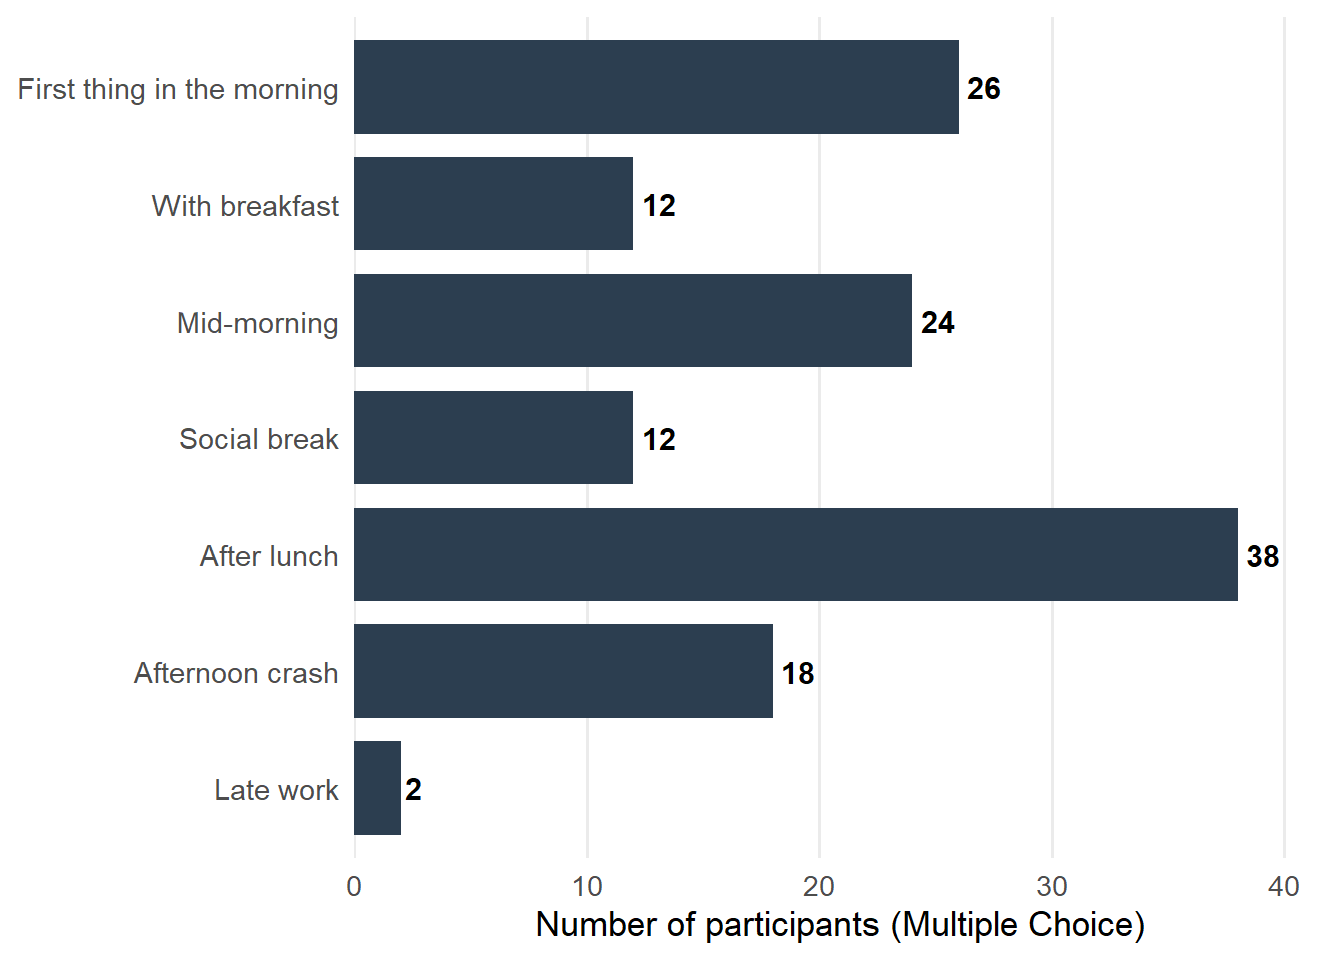
Coffee drinking is spread evently throughout the day, but after lunch stands out as the single most popular time (Fig 3). Mornings are still important, with both the “first thing in the morning” and the mid-morning cup ranking highly, but not as much as one might expect. Perhaps most people get their first cup of coffee at home. The mid-afternoon “crash” is also a common trigger for coffee. Social breaks and coffee with breakfast are mentioned less often. Coffee consumed late in the day is rare, suggesting that most people have a cutoff point (or better sleep discipline).
Why Do People Drink Their Coffee?
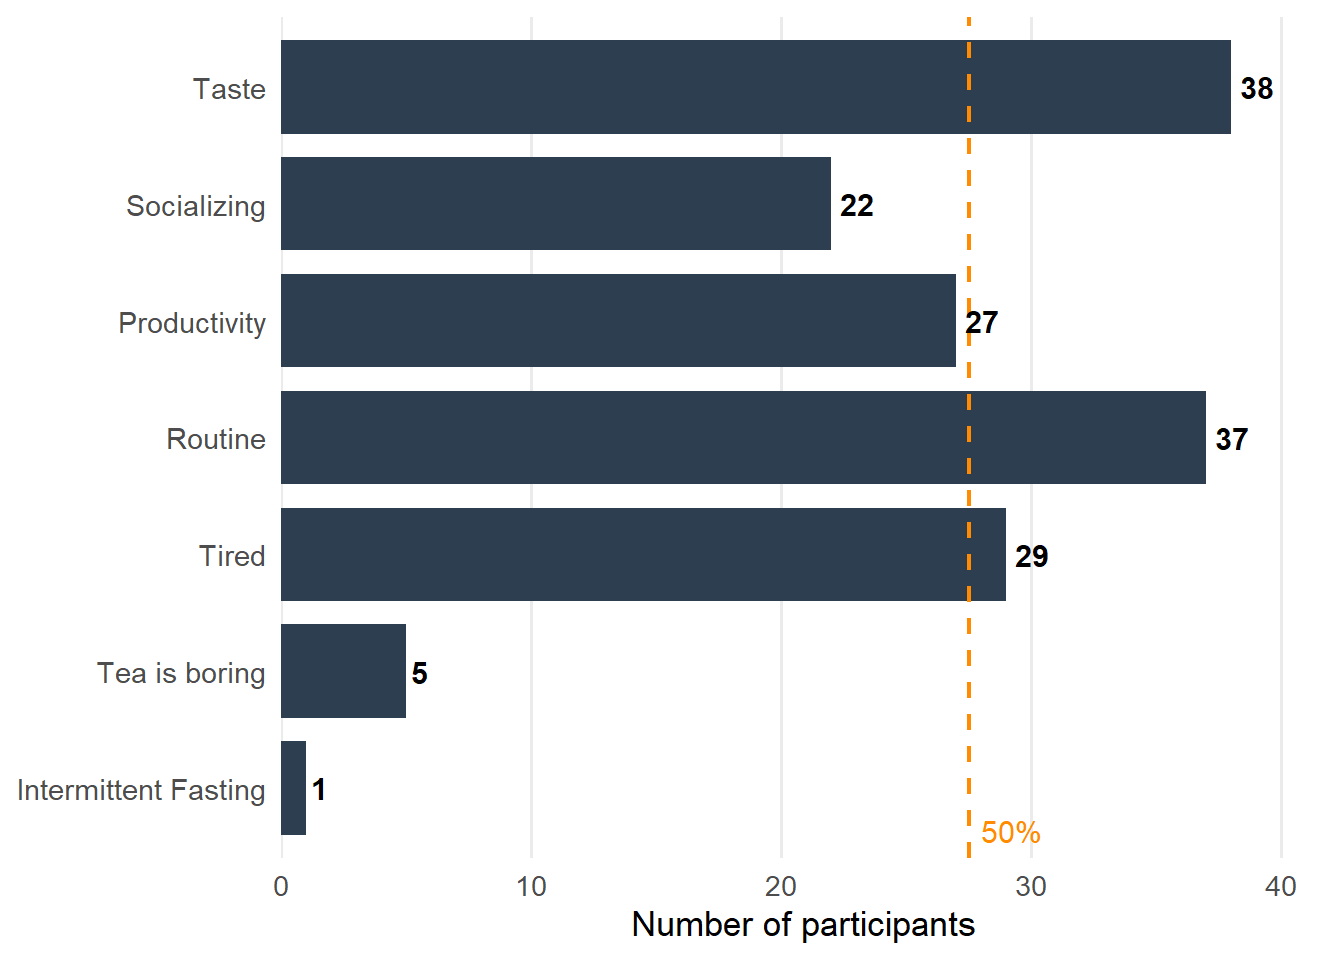
More than 50% of people drink coffee because they like the taste, it’s part of their routine and they’re tired (fair). Productivity and socializing rank highly too. And yeah, some people just think tea is “boring,” and others use coffee to get through intermittent fasting (Fig 4).
The Real Question: Downstairs vs. Upstairs
Now that we’ve covered the background, let’s get to the actual question: Does the quality of coffee really depend on its source?
Most people tend to use the downstairs cafeteria, while a smaller group relies on the upstairs machines. A few respondents bring coffee from home or a nearby café, but since that’s outside the institute system, we won’t include them from now on.
| Location | Count |
|---|---|
| Downstairs (cafeteria – fresh milk option) | 32 |
| Upstairs (machine – powdered milk) | 19 |
| Somewhere else (home, café, etc.) | 4 |
Focusing only on the in-house coffee options, there’s already a
noticeable skew toward downstairs. The question is whether this
preference is merely due to convenience or if it actually reflects a
real difference in quality.
Coffee Quality: The Radar Chart Showdown
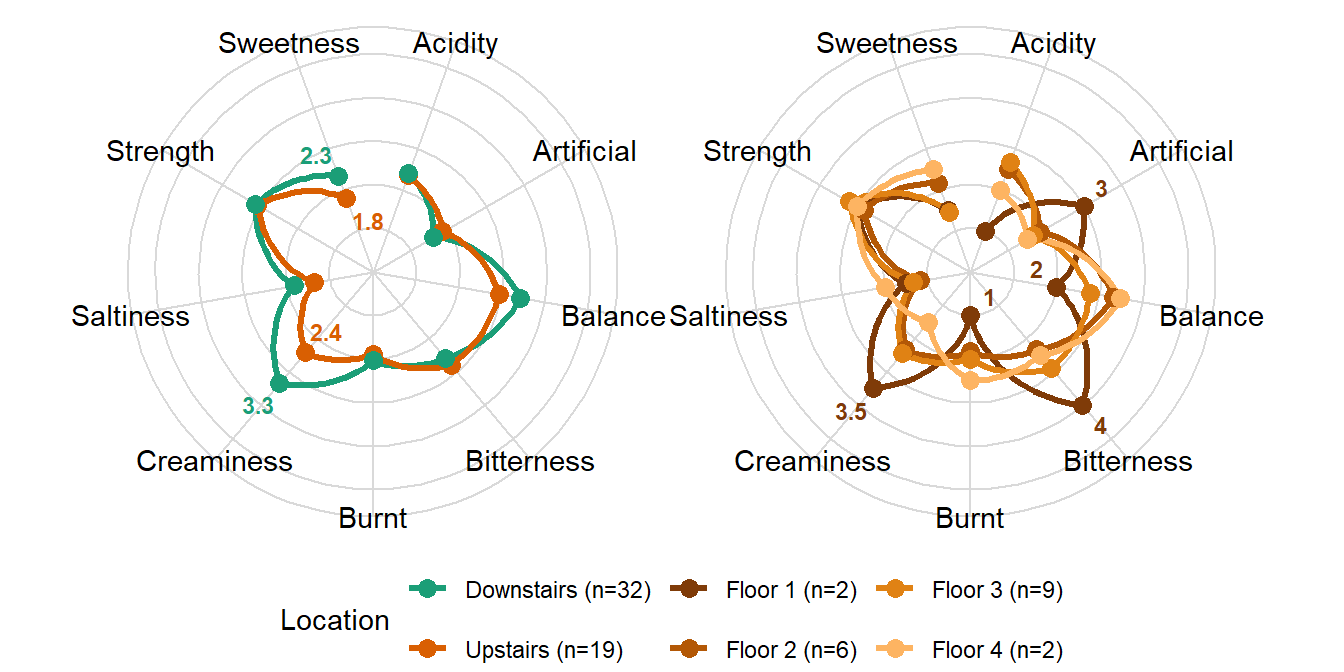
The coffee downstairs (green line) beats the coffee upstairs (orange line) in seven out of nine categories (see Fig 5, on the left). It scores much higher in terms of sweetness (2.3), creaminess (3.3) and overall balance (3.4). Floors 1-4 upstairs show consistent ratings across the categories, except for floor 1 (dark brown line), but the sample size is very small (n=2)(Fig 5, on the right).
Interestingly, six people reported that they only ever drink coffee downstairs. They might not even know what the coffee upstairs tastes like (for better or worse). Two reported that they only ever use the machines upstairs. One does not mind - or does not know - about the powdered milk, and the other prefers the proximity to the office.
Taste Profiles: What Do People Actually Taste?
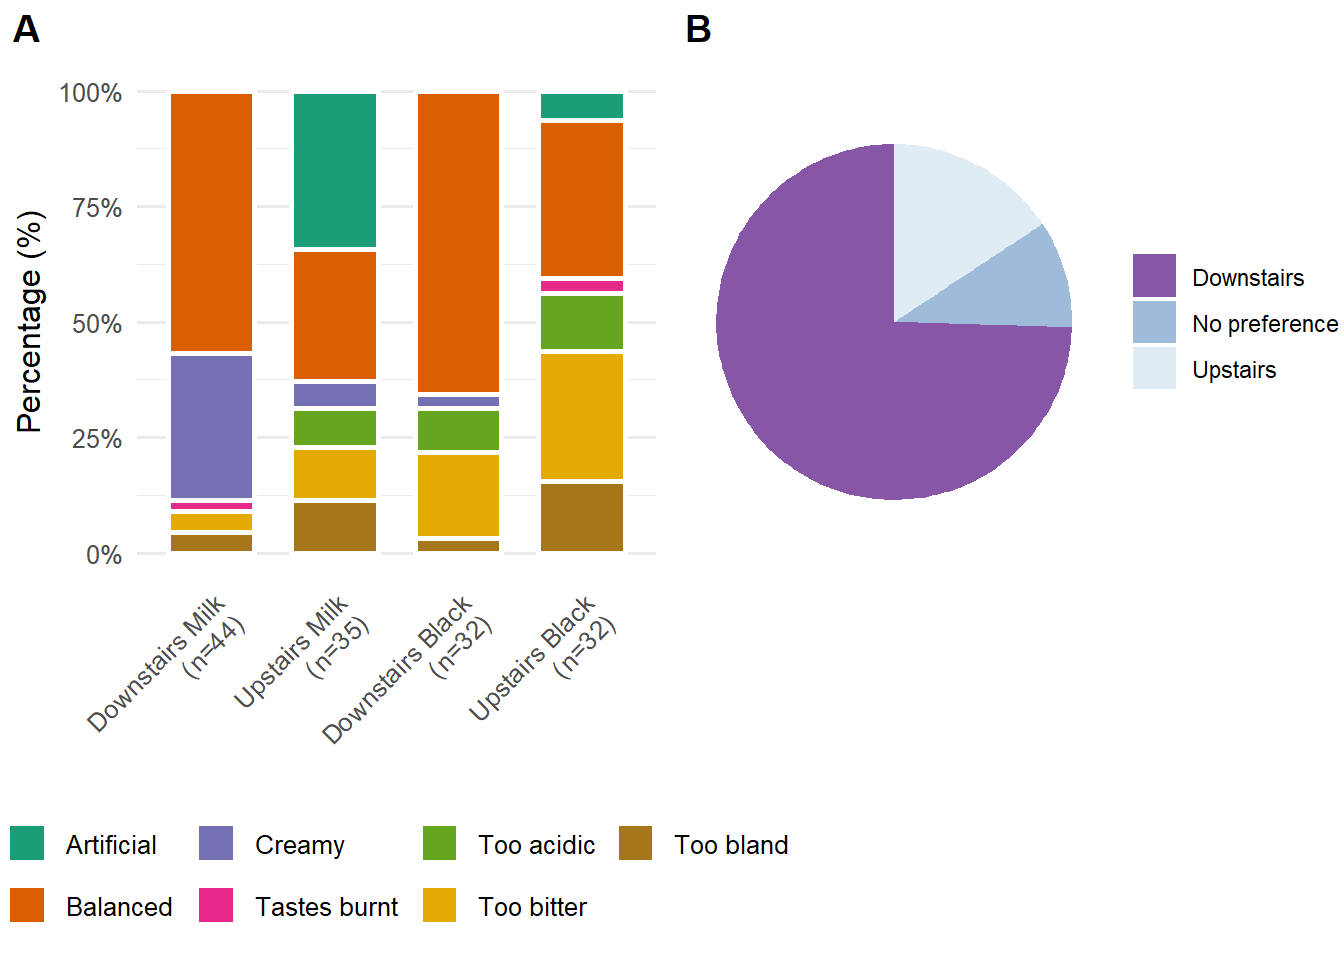
The difference between the coffee served upstairs and downstairs becomes more obvious when you look at the taste profiles (Fig 6A).
Downstairs milk-based coffee is mostly described as “balanced,” with a significant number of “creamy” ratings. Upstairs, milk-based coffee tells a different story. The percentage of “artificial” is much higher, and “creamy” ratings are reduced to almost none, probably due to the characteristics of powdered milk.
Black coffee is a bit more surprising. Downstairs, black coffee is still mostly perceived as balanced, while upstairs, black coffee shifts more toward “too bland” and “too bitter.” In theory, these locations shouldn’t differ much, so they may reflect subtle machine differences or how context and expectations shape taste.
All of this aligns with the overall preference: About 75% of respondents prefer the coffee downstairs (Fig 6B). Very few prefer the upstairs coffee, likely due to proximity rather than taste. Most people explicitly mention “real milk” or an overall better taste as the reason for their preference.
Coffee Knowledge: Do We Know Where It Comes From?
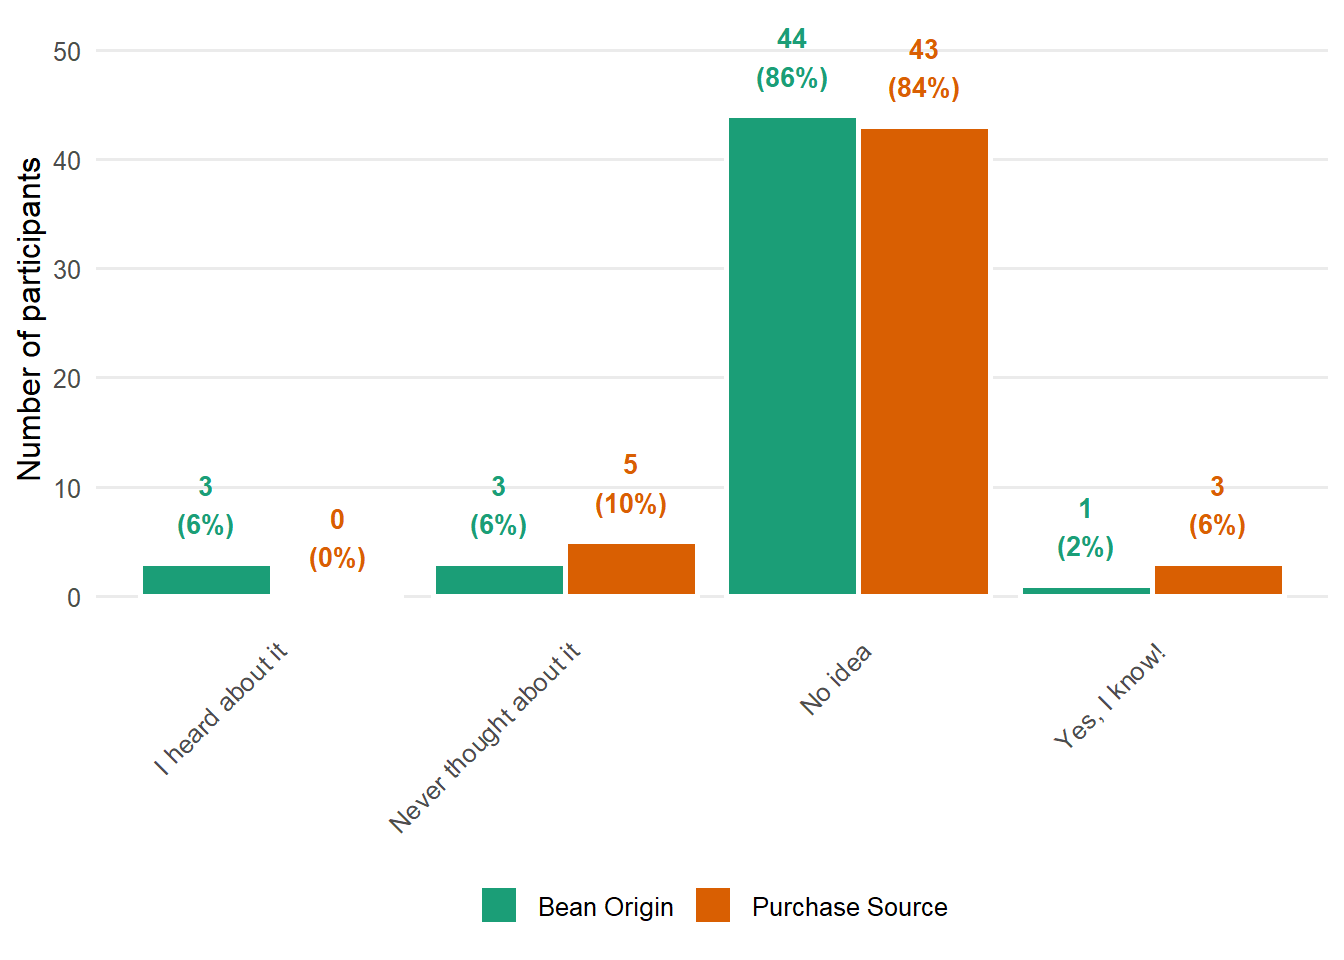
Most institute staff have little knowledge of where their coffee comes from or who supplies it (Fig 7). When asked about the origin of the beans (shown in green), 44 respondents (86%) said they had “no idea,” while only one person knew the country or region. For the purchase information (in orange), 43 respondents (84%) admitted to having “no idea,” with only one knowing the actual supplier. Interestingly, they were not the same person who knew the origin.
For the curious: our coffee comes from Hochstrasser, a Swiss supplier with a wide product range. However, the “Giusto Crema/Espresso” label displayed on the machines doesn’t appear in their standard product list. So, it’s difficult to find information about it, such as its origin, certifications, and whether it’s organic.
What Could Be Better? (The Wish List)
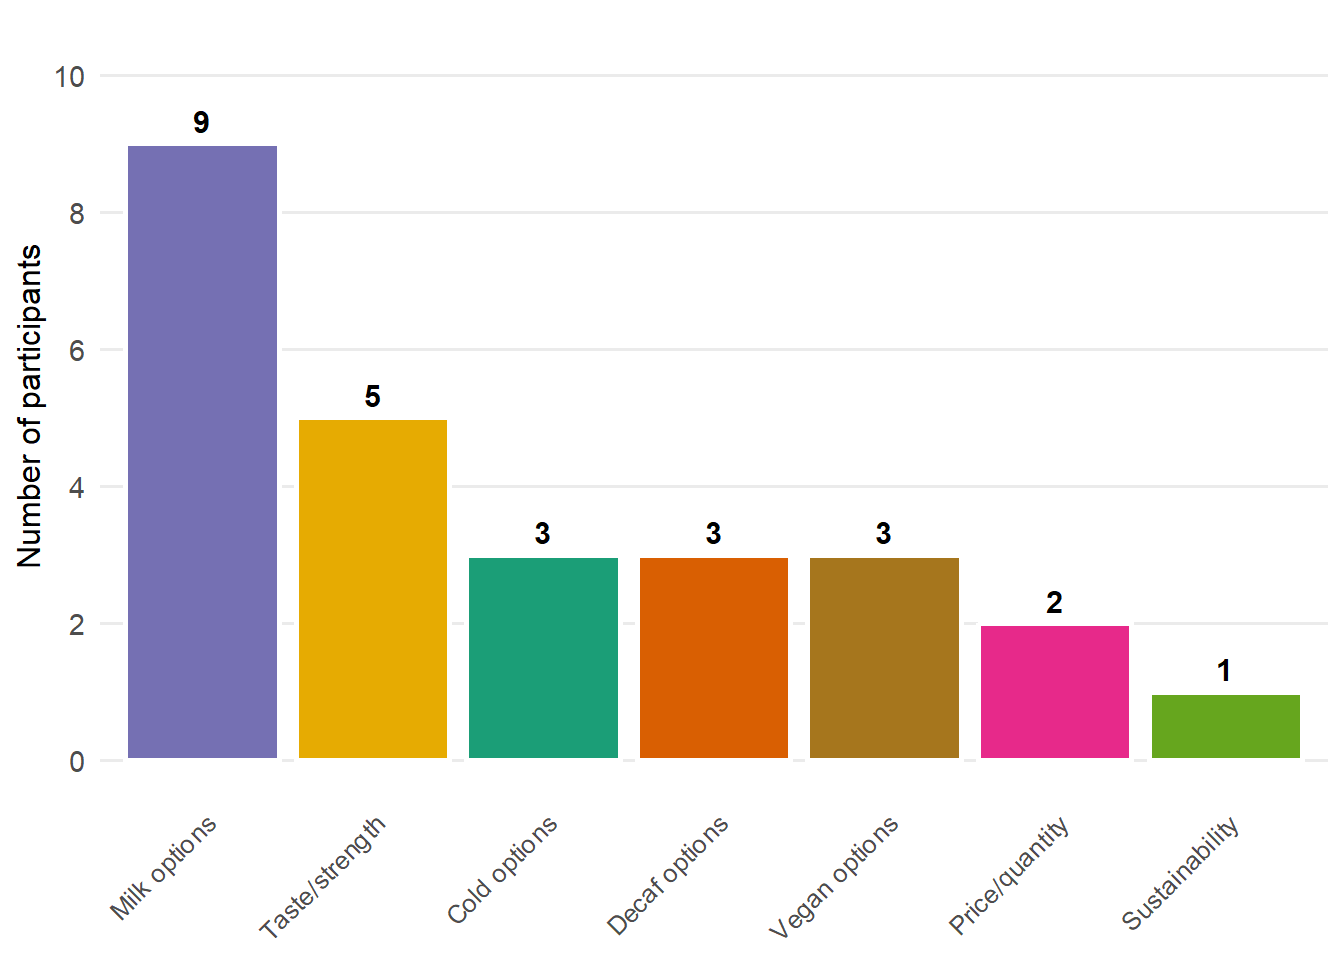
Real milk is by far the most requested improvement (see Fig 8). Of the 33 responses, nine (27%) explicitly ask for real milk on all floors. The reasons are consistent: better taste, more convenience, and avoiding the downstairs “milk queue.” Next are taste and strength, with suggestions for less bitter coffee, stronger decaf, and better beans. Some respondents also requested plant-based options and iced drinks, reflecting more diverse preferences. One person mentioned sustainability, such as fair trade and organic products. Another humorously suggested increasing prices. Notably, a few respondents are perfectly happy with the current situation.
Key Takeaways
Real milk is the priority. Nearly 75% of respondents prefer coffee from downstairs, and over a quarter of improvement suggestions focus on expanding access to real milk on other floors. Even for black coffee, location seems to matter, suggesting that factors beyond milk, such as differences in machines, water temperature, or expectations, influence perception. The location may also play an important psychological role. People tend to stay longer in the cafeteria, meet colleagues for a break, and socialize more. This could affect the perceived taste of coffee, whether black or with milk.
Coffee serves as working fuel. Taste and routine play a key role, but tiredness and productivity are also major drivers, suggesting that people are either keeping up with demanding workloads or not getting enough sleep.
Hierarchy doesn’t seem to influence consumption. Most people drink around two cups per day, regardless of their academic position.
We don’t think much about where our coffee comes from. Around 85% of respondents don’t know, which points to a missed opportunity for transparency, and possibly for improving quality.
What Could Change
- Add real milk and/or plant-based milk options to at least one location upstairs
- Post visible information about coffee origin and certifications
- Consider offering ice lattes or providing freezers where people can store ice
A Note on Tea
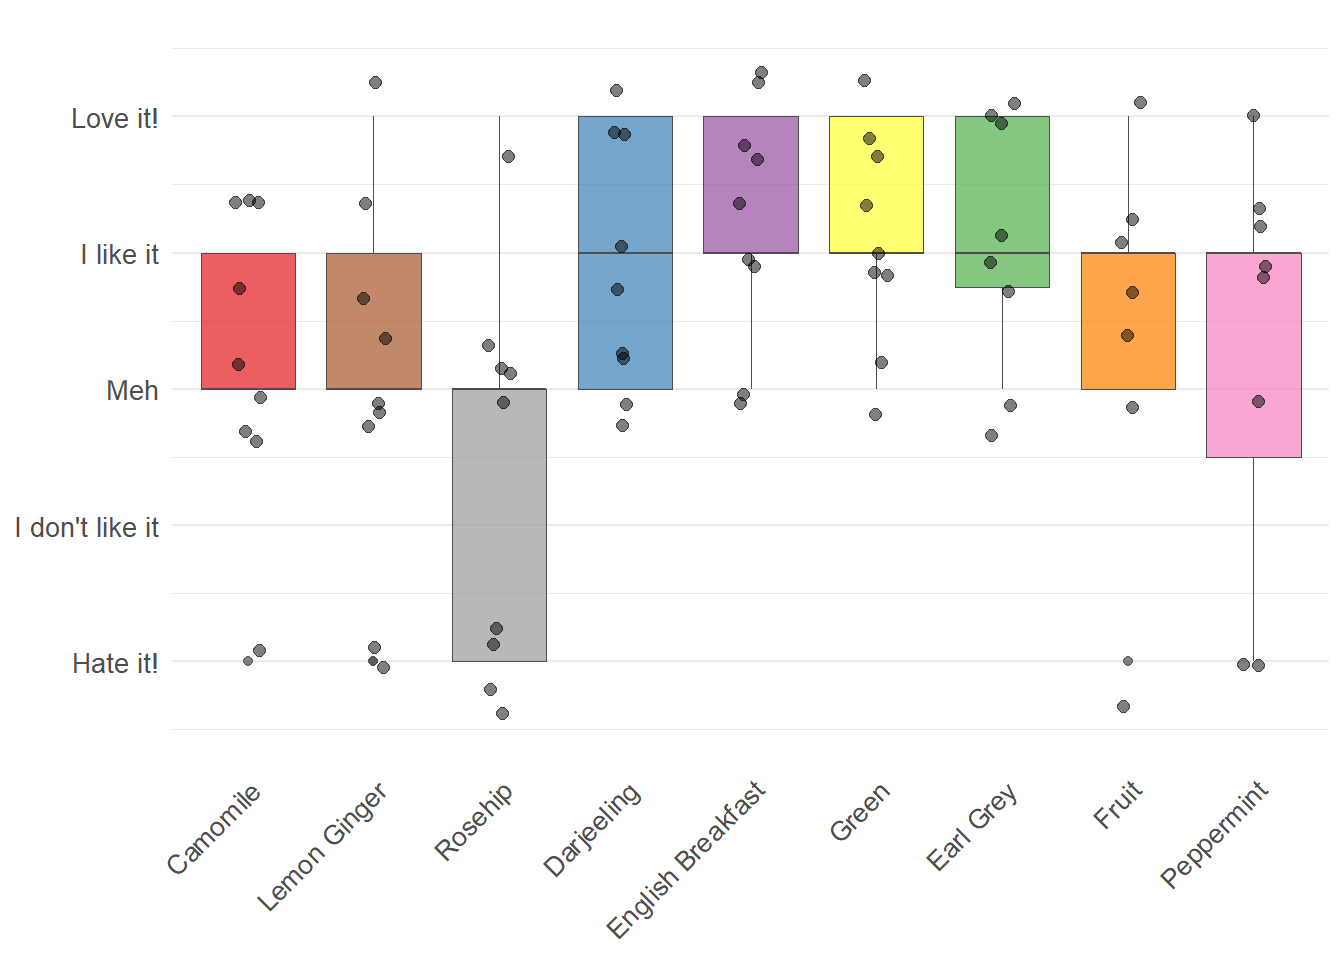
This survey included only nine tea drinkers, which is too small of a sample size for meaningful analysis. A follow-up survey focusing specifically on tea would be valuable if we can get enough responses. Preliminary results show that most tea drinkers consume only one cup per day. Green tea, English Breakfast tea, and Earl Grey tea are clearly the favorites, with most respondents saying “I like it” or “I love it!” (Fig 9). Rosehip tea was widely disliked, while fruit and other herbal teas fell somewhere between “meh” and “I like it.”
Final Thoughts
If the Swiss TPH would like to bring some extra happiness to the coffee break ritual of researchers and students, offering real milk on every floor would go a long way. It’s a relatively small change with a surprisingly large impact.
Thanks to everyone who participated. ☕
All code and data for this survey are available on GitHub if you want to dig deeper or adapt it for your own institute.

Nadia Neuner-Jehle
PhD student